

Three steps to improve transparent cybersecurity reporting with coverage metrics
“Cybersecurity coverage metrics are hugely important because they help to make security reporting more trustworthy.”

Philippe Korur
read
Philippe Korur is an experienced cyber risk consultant at PwC UK, leading the PwC Cyber Risk Reporting Platform. That means there aren’t many better people to talk to about cybersecurity metrics, measurement, and reporting.
Philippe joins us to discuss the importance of context around cybersecurity metrics. Informational and policy metrics alone are not enough. It's essential to report coverage metrics to fully understand security posture. First, we will outline four key types of security metrics – informational, policy, coverage, and diagnostic – then Philippe shares three steps to improve coverage metrics:
1. Establish risk appetite
2. Understand attack surface
3. Automate
What are the types of cybersecurity metrics?
In the Panaseer platform there are four types of security metrics:
Informational metrics
These are straightforward numbers. You have x devices. You have y vulnerabilities. You have z privileged accounts. These tend to be made up of the data coming from the various tools your security team is using.
Policy metrics
These show your performance against the organization’s cybersecurity policy.
Coverage metrics
These show how much of the total estate a security control is covering. They help track the coverage and completeness of data sources to provide awareness of what information you can’t capture.
Diagnostic metrics
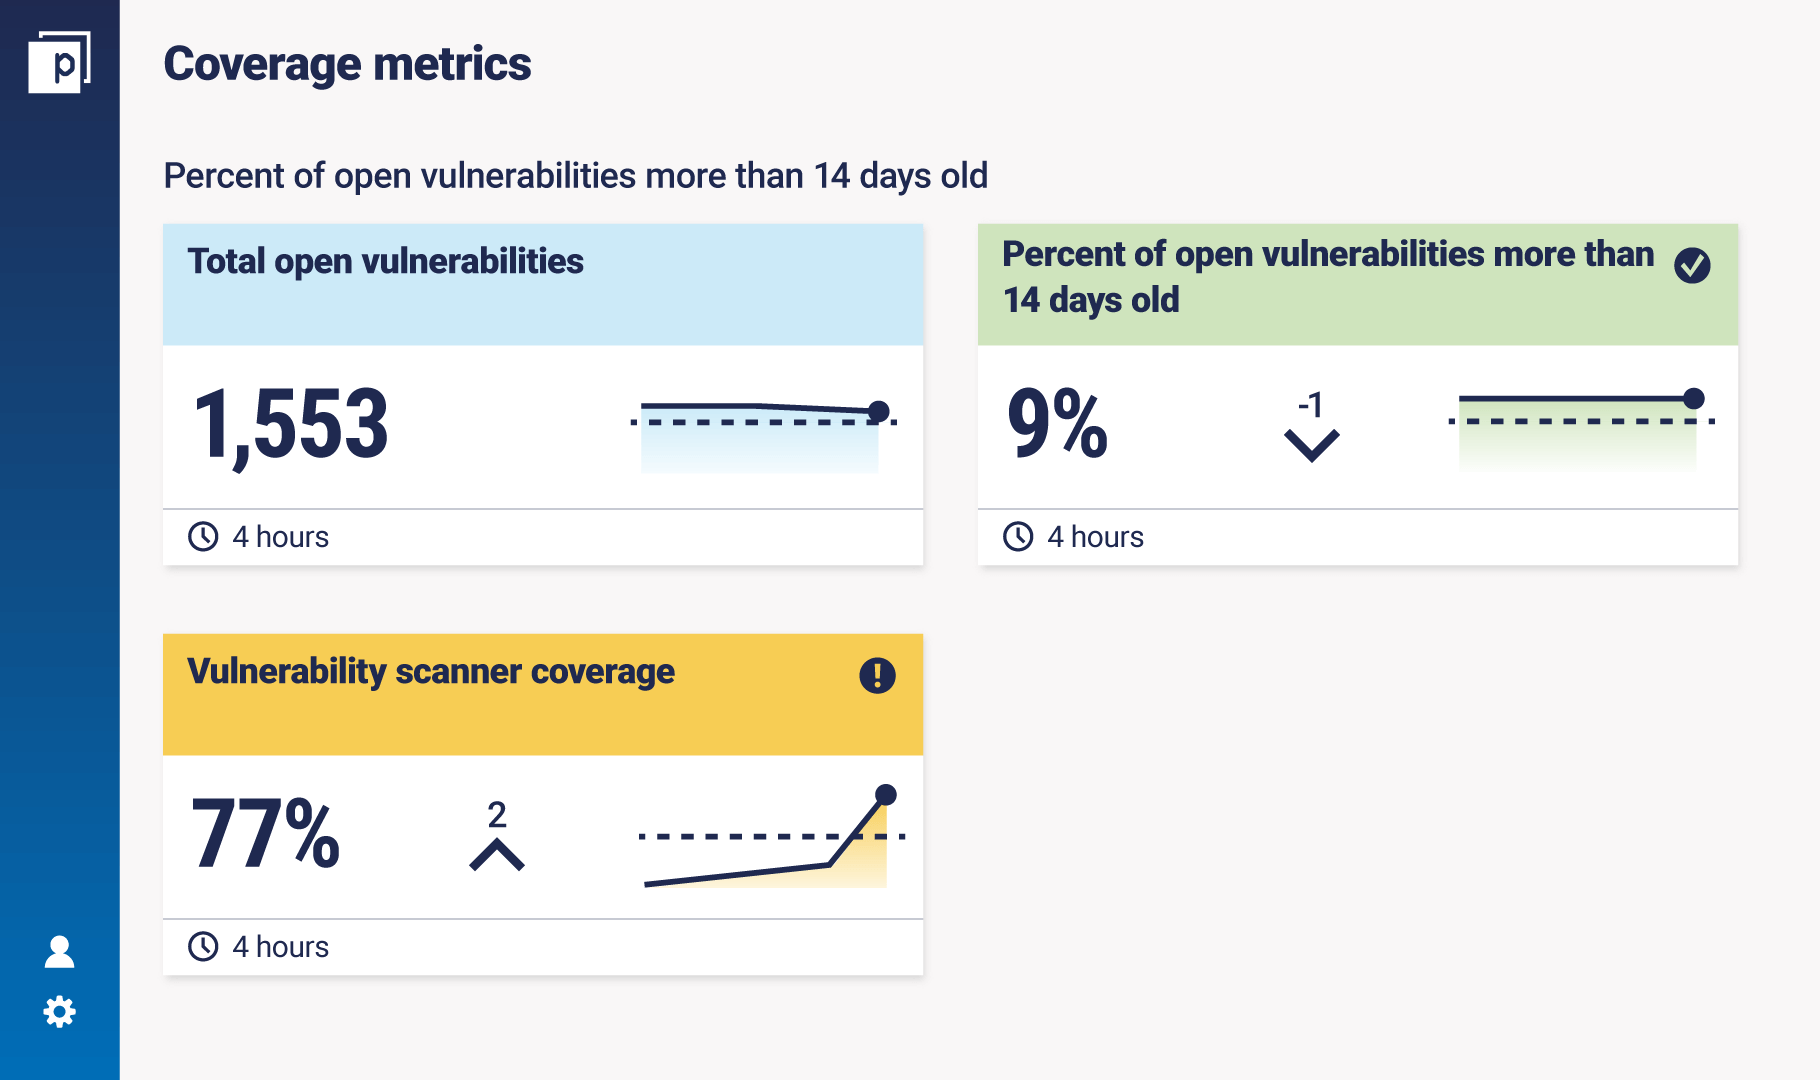
These metrics provide in-depth insight to help narrow down the root causes of subpar performance and quickly identify actions to reduce risk. This type of metric is for organizations with maturing Continuous Controls Monitoring capabilities, which won’t be covered in this article. (But get in touch to find out more about them!) Let’s illustrate with an example metric: the percentage of open vulnerabilities more than 14 days old.
The goal of measuring this metric is to minimize that percentage and therefore reduce risk. The policy is to remediate open vulnerabilities within 14 days. This is your ‘bar’ and relates to your organization’s risk appetite and tolerance.
The information is that, for example, 9% of open vulnerabilities are more than 14 days old. But if you look at this percentage independently, you don’t know how many systems it covers. You could be scanning or pen-testing only a certain amount of infrastructure.
The coverage is how much infrastructure or how many assets the vulnerability scanner scans — in this case 77%. The coverage behind the measurement is essential to understanding how true it is, and thus being transparent with reporting.
Why coverage metrics are so important
“Coverage metrics are often forgotten,” says Philippe. Policy metrics are almost always in place because most organizations have policies. And the same goes for informational metrics (because otherwise you don’t have any numbers).
“But when they are reported without the element of coverage, the metric is misleading and can’t be fully trusted by the audience. "Coverage metrics are hugely important because they help to make security reporting more trustworthy. That means you can have more robust decision-making around improving your cybersecurity posture by strengthening controls that appear weak or adding controls in areas that require it. This level of transparency is essential to provide effective governance and oversight by execs and the board.”
Who owns coverage metrics?
Philippe says that close monitoring of cyber and tech risk requires access to necessary tooling owned by the first line of defense, IT, and security teams, especially when it comes to attack surface, which is about understanding your IT assets. However, he has noticed that recently the second and third line of defense teams are becoming more willing to challenge the first line on the validity of security metrics. It’s a good step towards improving accountability and transparency in reporting, which is the goal of these metrics, after all. Who sees coverage metrics? Generally, it’s for the board, risk steering committees, or technology risk. “Whoever it is, if they’re being presented with policy or informational metrics alone, it will be misleading.”
Three tips for creating effective coverage metrics
1. Establish risk appetite
“It’s essential to have an understanding of (1) the top cyber risks, (2) the risk appetite and tolerance levels to these risks, and (3) what the organization has that needs to be secured to minimize the likelihood and impact of these risks to the acceptable levels,” says Philippe.
"You may not have the budget to secure all assets, however, this must be reported to execs so they can make their decisions and prioritize security investment backed with facts and in line with the established risk appetite.”
Who is responsible for establishing the cyber risk appetite and tolerance levels?
Generally, the security team is in agreement with the board (or risk committee). “The decision usually isn’t left with the CISO alone, but with relevant executives from across the board, such as the CTO, CIO, CRO, or CEO, because of the strong alignment between risk appetite and cybersecurity prioritization.”
2. Understand attack surface
CAASM – Cyber Asset Attack Surface Management is a hot topic in cybersecurity, especially when it comes to metrics and measurement. Philippe says: “If a company can nail CAASM, they will have the denominator for most of their key metrics. “The complexity of coverage metrics is really in understanding your organization’s attack surface.
How many systems do you have? How many third parties? How many on-prem versus cloud? And crucially, you need to understand the changing state of that attack surface, such as the influence of shadow IT or mergers and acquisitions.”
The example Panaseer dashboard below shows how the attack surface changes over time, in the context of total devices, externally facing devices, or devices missing from the CMBD. It also highlights potentially risky devices that aren’t identified, don’t have an owner, or are missing from at least three controls.
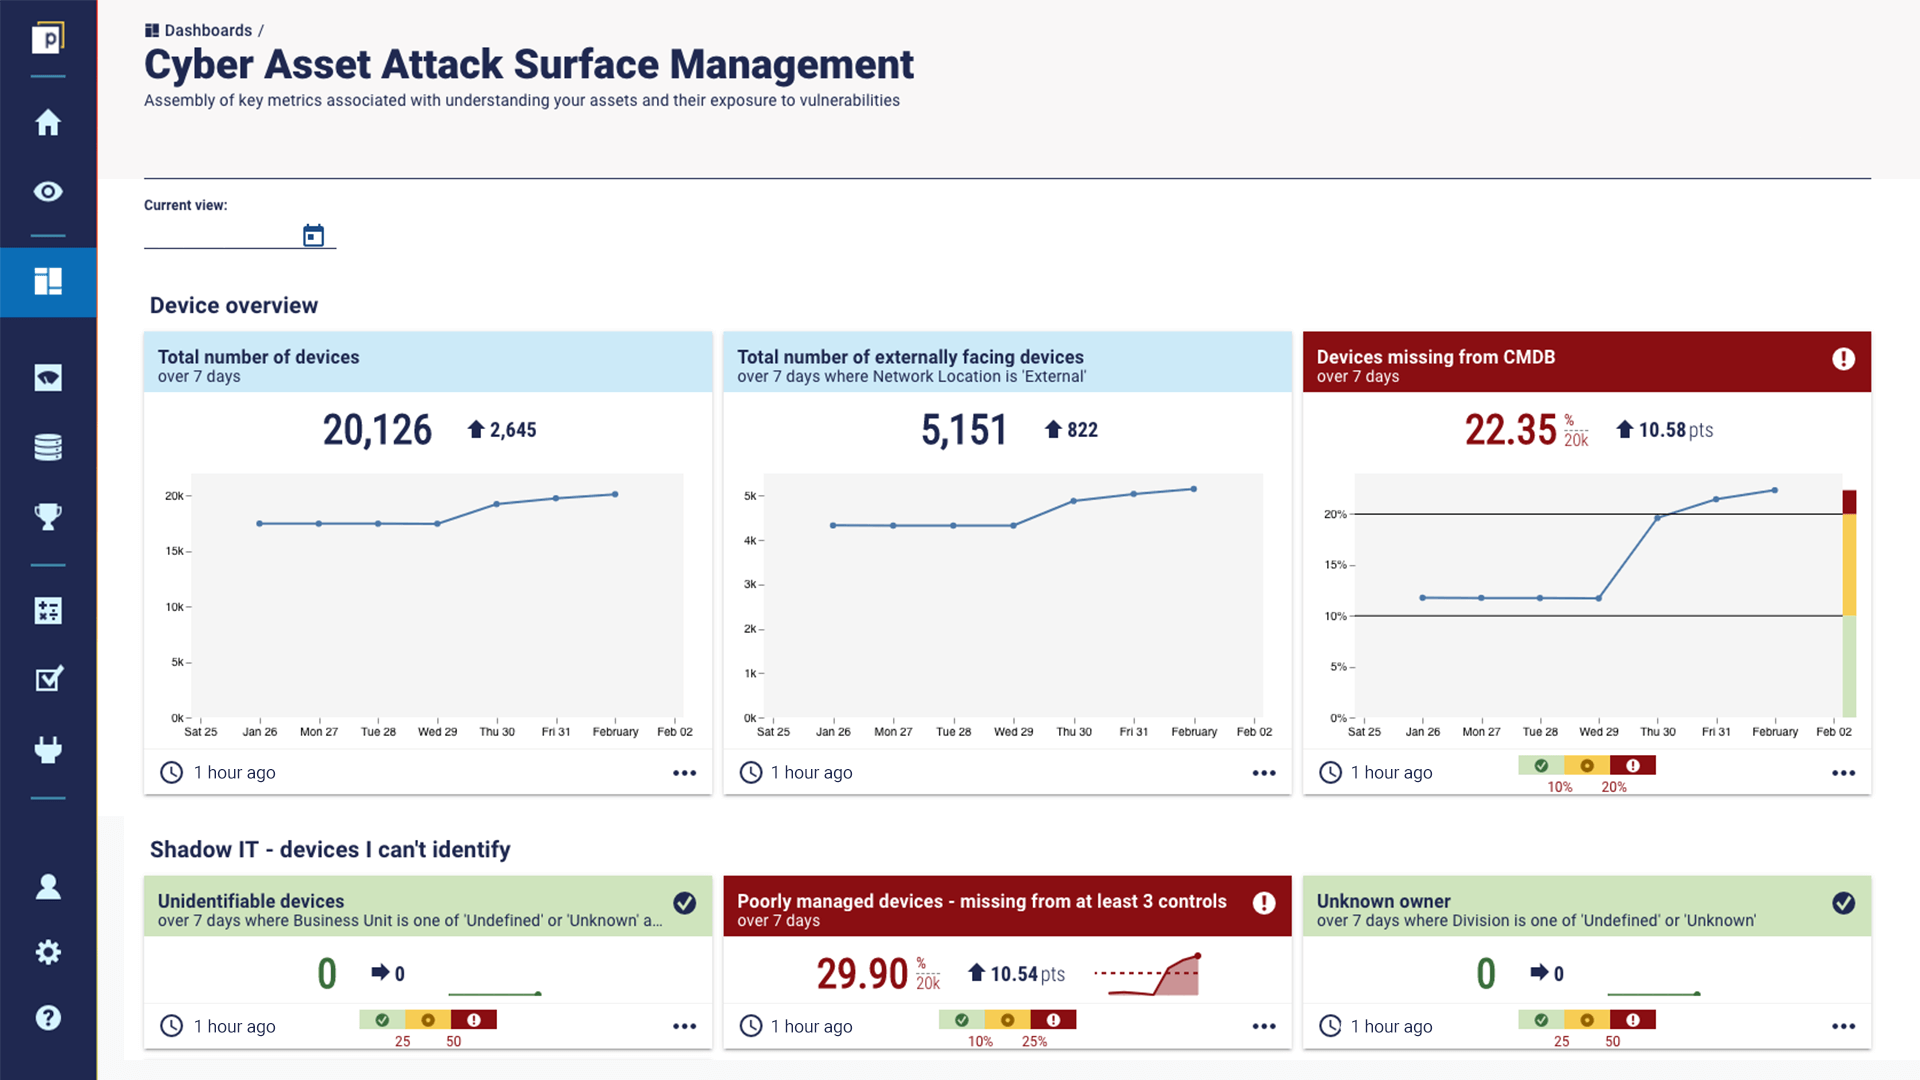
To find out more about Panaseer’s CAASM platform, get in touch or book a demo.
3. Automate
“More organizations are looking to introduce higher levels of automation and data analytics techniques into their security reporting,” notes Philippe, “because understanding the attack surface is all but impossible without it. "You can’t rely on manually counting your ever-growing IT estate. You need to compare different tools against each other, such as a vulnerability or asset discovery scanning tool and the company’s IT asset register (CMDB) [similar to the above dashboard] and analyze the results to understand the attack surface and evaluate how well you are covering it. “Automation is really important here. Many organizations find it complicated to understand the attack surface because they don’t have the analysts in-house to support the level of analysis required. That’s where a tool like Panaseer really shines.”
(For full disclosure, Philippe is the collaboration lead between Panaseer and PwC).
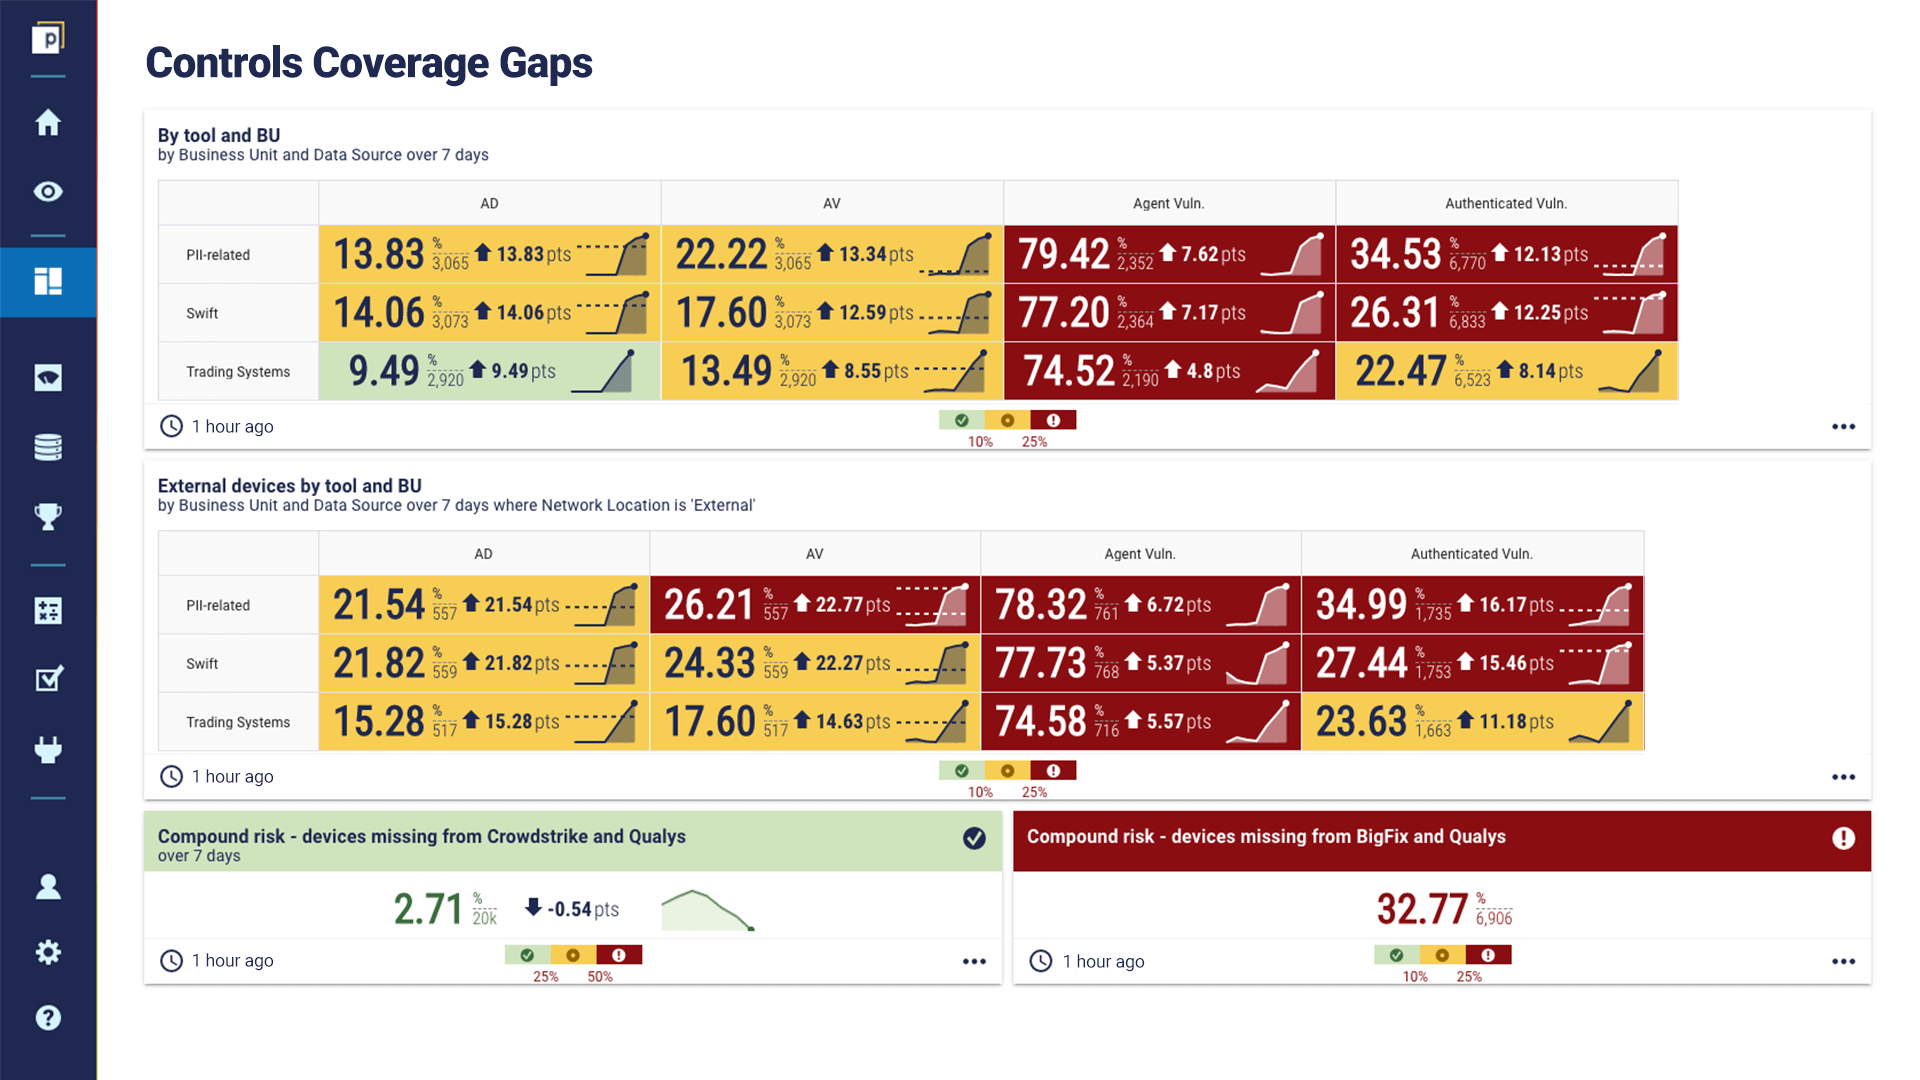
With advanced levels of automation, you can compare controls coverage gaps split by tool and critical business process. In this example, the mission-critical infrastructure for priority protection is PII-related systems, Swift processes, and trading systems.
The final word
Coverage metrics are essential to cybersecurity reporting and improving the trust and transparency therein. As Philippe suggested in an article on cyber risk reporting, and reiterated in our interview, this can help organizations have more strategic conversations and make better decisions about the attack surface, vulnerabilities, and cyber risk prioritization. To find out more about how Panaseer can help with cybersecurity coverage metrics, either with CAASM or a more extensive Continuous Controls Monitoring platform, get in touch for a demo.
About the author
Philippe Korur
Related blogs

Three measurement essentials for reporting cybersecurity to the board