Overcoming Log4Shell with Continuous Controls Monitoring
The recent discovery of a new zero-day exploit, Log4Shell, emphasises the need for security teams to become more efficient in prioritising and remediating vulnerabilities. The Apache Log4j vulnerability has created a major problem for cybersecurity teams since its discovery on December 9, 2021. The exploit – known as Log4Shell or CVE-2021-44228 and CVE-2021-45046 – affects an open-source Java logging library that’s widely used in many applications, often as a dependency, leaving systems exposed even to novice hackers. Remediation efforts are going to be complex, forcing organisations to divert their resources from other priority vulnerabilities. Our research shows that security teams were already under huge pressure, often struggling with complex processes and technology. There’s clearly an urgent need for security teams to become more efficient. This begins with improving the way they prioritise and remediate vulnerabilities, so they can focus on the threats that pose the biggest risk to their organisations, like Log4Shell.
Using continuous controls monitoring to remediate Log4Shell
Continuous Controls Monitoring (CCM) makes security teams more effective and efficient. The platform sits above your existing security tooling, providing visibility of all your assets, users, applications and databases, and giving confidence that all your controls are working. The technology also provides several benefits that enable you to more effectively prioritise critical vulnerabilities, like Log4Shell, and create more efficient remediation processes.
1. Vulnerabilities in context
CCM maps systems and vulnerabilities against their context within your organisation. For example, you can see where Log4Shell appears on internet-facing assets which could be directly exploited by threat actors. It also goes one-step further, overlaying data on the affected business unit, geographic location, the specific business process it relates to or if it’s among the organisation’s crown jewels. Organisations can then prioritise business-critical systems and processes ahead of less important tools. For example, a financial services firm would want to remediate the Log4j vulnerability on payment systems before fixing this same vulnerability in low-value assets. 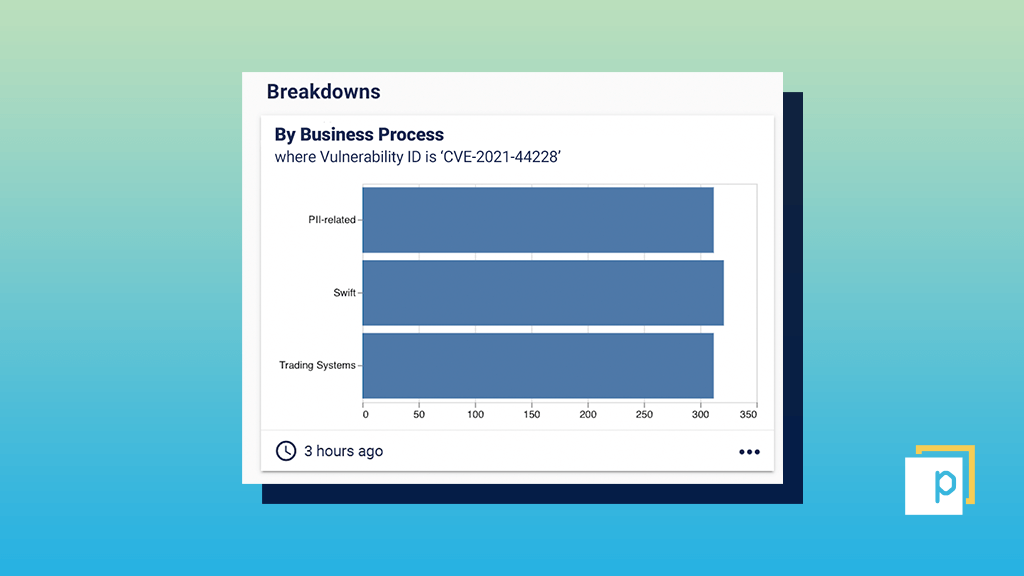
2. Single source of truth
Security teams often have more than one vulnerability scanner monitoring their IT estate. This creates an obvious problem – which tool do you trust is giving you an accurate reading of your vulnerabilities? And how do you begin to cross-reference all the data? By bringing together all the data from across your vulnerability scanners, CCM provides a single source of the truth and makes the process more efficient as you no longer need to manually compare data sources.
3. Automated ticketing and evidenced remediation
Once a vulnerability has been discovered, remediation efforts are commonly managed using a ticketing system. However, these systems often fail to accurately track the length of time it takes to fix a problem, or whether the vulnerability has even been properly fixed. CCM tools overcome this problem using Campaigns. This feature enables you to target specific vulnerabilities, such as Log4Shell, using dashboards that evidence remediation against specific deadlines. This helps security teams to ensure critical vulnerabilities are fixed within agreed timeframes.
4. Ownership
Alongside setting deadlines for remediation, CCM identifies who’s responsible for the IT system that's affected by a particular vulnerability. This ensures security teams are clear on who's accountable for fixing the issue, reducing the risk that problems will go unsolved due to a lack of ownership.
How to measure your exposure to Log4Shell using Panaseer
Using the Panaseer platform, you can create a dashboard to quickly understand your potential exposure to the Log4j vulnerability across your IT environments. This process can be replicated for other zero-day vulnerabilities that are uncovered in the future – it’s just a case of changing the vulnerability you’re searching for at step three below. This step-by-step guide includes examples of key business attributes that enable you to prioritise your remediation efforts to the most critical vulnerabilities. These business attributes can be initiated using IT service management (ITSM) integration and tracked through our Campaign functionality.
Step 1
Before setting up your dashboard, you’ll need to have completed a vulnerability scan of your infrastructure. Once this is complete, click the ‘New Dashboard’ button in Panaseer. 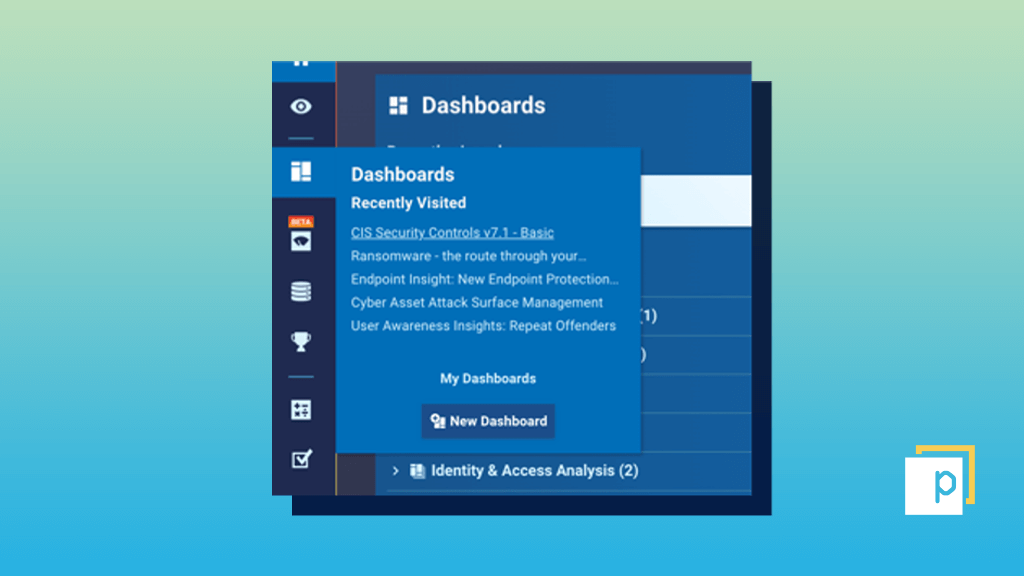
Step 2
Search for the metric ‘Vulnerability detections by vulnerabilities’ in the metric search bar, then drag and drop into the dashboard ‘Section’ on the right-hand side of the screen. 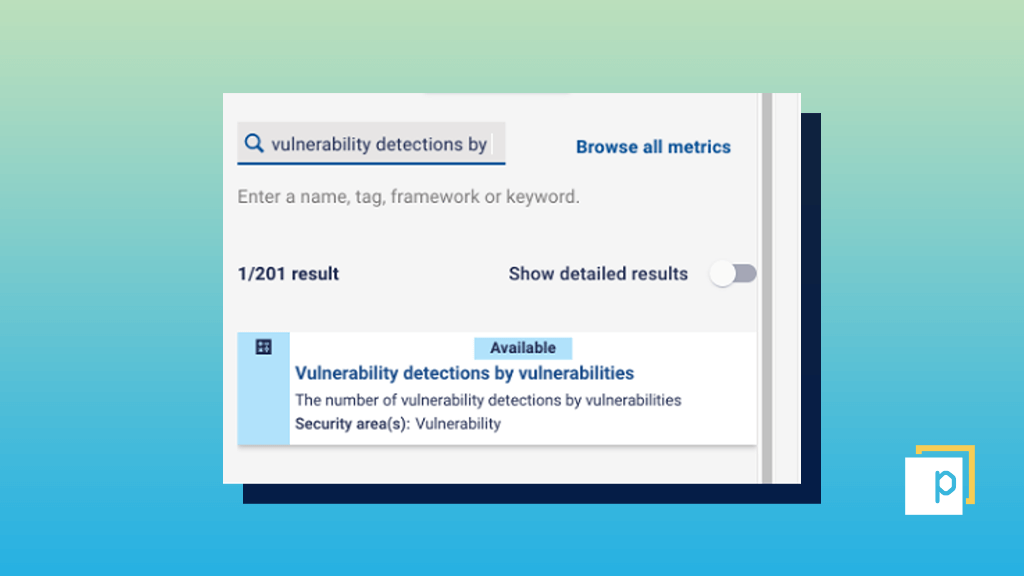
Step 3
Click on the arrow on the right-hand side of the metric title, and select the ‘Filters’ button to apply the required filter for either ‘CVE ID’, CVE-2021-44228, or associated ‘Vulnerability ID’. 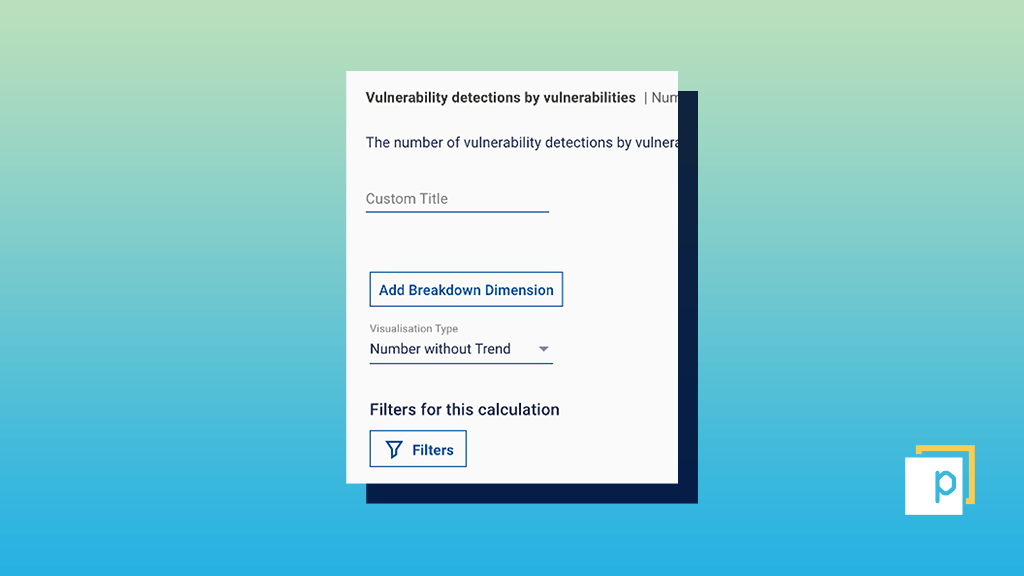
Step 4
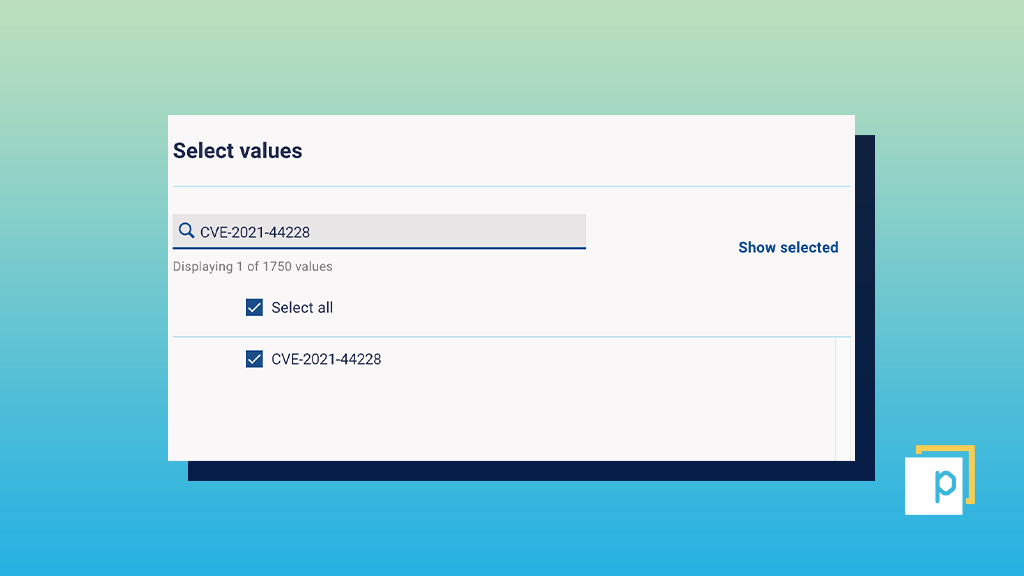
Apply the CVE ID, CVE-2021-44228, or associated vulnerability ID in the Search field and check the boxes.
Step 5
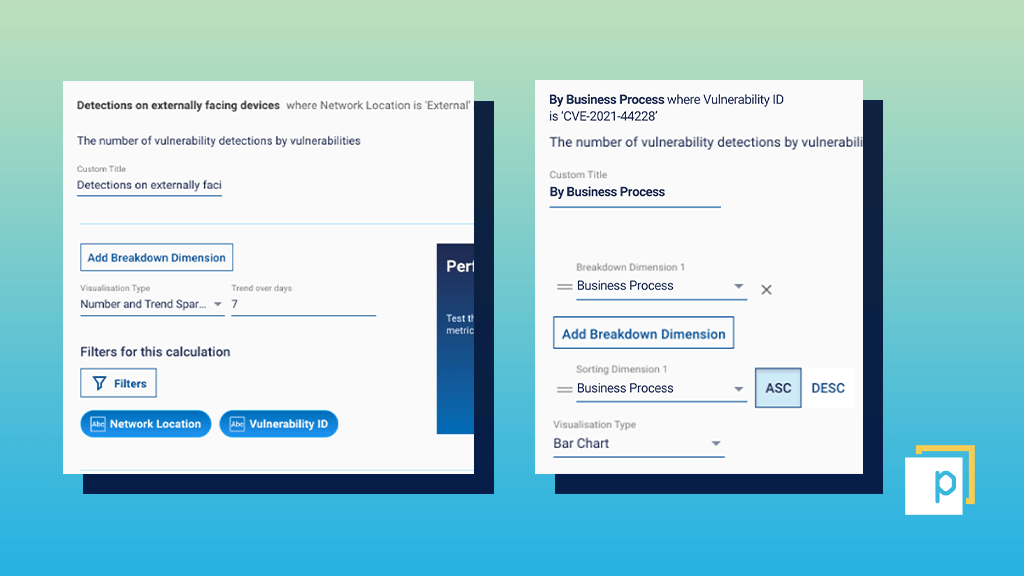
Make sure to update the visualisation type to suit your preference (for example, a time series chart will help you monitor exposure over time as your remediation efforts begin). We also recommend renaming the metric, applying thresholds or adding in extra business-aligned filters or breakdown dimensions to focus in on your priorities for remediation. Suggested filters or breakdowns that can help drive prioritisation and ownership include:
- Network location – find detections on externally facing devices.
- Business unit.
- Department.
- Criticality (crown jewel devices).
- Region.
Step 6
Give your dashboard a title and click ‘Save and preview’ to view your creation. You can also publish your dashboard for others to view. 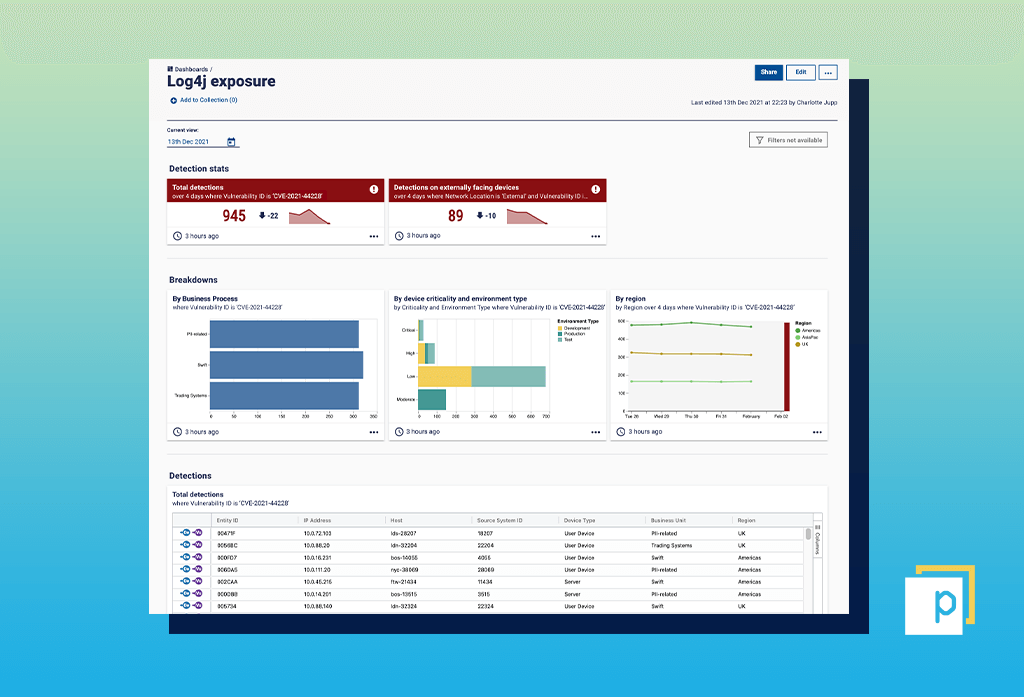
Step 7
Finally, make sure to use your dashboard and Expanded Cards to initiate your remediation efforts and track progress. Click into any metric and use the ‘Action’ tab to export the data to CSV, raise a ticket directly into your ITSM and remediation workflows, and create a Campaign to track the progress of that remediation.  Get in touch to find out more about Continuous Controls Monitoring and how it can create more efficient, data-driven cybersecurity controls.

