

Three measurement essentials for reporting cybersecurity to the board
Cybersecurity is now a key focus in the boardroom, with new regulations like DORA and NIS2 making boards legally accountable for cyber risk. A recent report found that 76% of boards discuss cybersecurity once per month, but also found a disconnect between the CISO’s understanding of their organization’s cybersecurity capability and that of the board.

Barnaby Clarke
read
So, if you want to improve how you report cybersecurity posture to your board, wouldn’t it be great to get advice from one of the world’s leading technology companies?
Well look no further. For this edition of Metric of the Month, we spoke to Pam Lindemoen, CISO Advisor at Cisco. "I advise CISOs to tell your story at the board level,” says Pam. “You can’t just show your metrics. You’ve got to articulate how effective your controls are, which could take the form of two or three scenarios from your previous quarter that demonstrate what you've seen in your environment and how effectively your control stack is operating.” For an impactful reporting cybersecurity to the board, Pam highlights three essential measurement areas:
- Measuring the maturity of a security program
- Control coverage across people, processes, and technology
- Risk levels against tolerance
How to report the maturity of your security program to the board
Many security teams are subject to third-party maturity assessments, which often tell them what they already know. But for others, particularly less mature organizations, it’s crucial to start or improve a security program. In Pam’s experience, it can be time-consuming but it’s a necessary step. First tip: “Share metrics that give the board a sense of your organization’s cybersecurity maturity.” This can be done in a variety of ways, but Pam suggests using an industry-standard framework such as NIST. Provide an overview of the effectiveness your controls across the five functions benchmarked against industry peers: identify, protect, detect, respond, and recover. You can also run a third-party maturity audit to assess your security against a given framework, usually NIST as we mentioned. Then they will give you a score on a tier system, based on your controls. For example:
- Tier 1: Your controls are informal, ad-hoc and responsive.
- Tier 2: Your controls are risk-informed and you have some policies in place.
- Tier 3: Your controls are repeatable and established by policy.
- Tier 4: Your controls are adaptive and you’re continuously improving them.
But you also need to keep in mind, warns Pam, that these audits are point-in-time. For one thing, your maturity may fluctuate between audits if you’re not continuously monitoring. And for another thing, the technology landscape is always changing. Be wary of that and keep aside some budget for important new technology.
For example, passwordless authentication should be high on the agendas of more mature organizations, but it probably won’t be an audit point or in any framework. Once you’re clear on your maturity, you should also show your aspirations for a future state.
These maturity audits can provide you with a suggested future state, which will help you address gaps and inform your next actions. You can treat them as a roadmap to reducing your cyber risk. Where will you be in six months? A year? Three years? And what projects will you need to run to achieve that? Reporting like this is meaningful and can help align everyone with your plans.
2. Report the effectiveness of your controls across people, processes, and technology
A good security report will show how effective your security controls are around people, processes, and technology. “Your stakeholders want to know that you understand your operational environment, and that you’re managing it. You need to show them evidence that your controls are effective, where they are running in your environment, and whether they are working within policy,” says Pam.
Many controls are focused on particular technologies, so coverage metrics can help to show the effectiveness of your controls and your security investments. They’re also essential for showing the context of your measurement and helping improve confidence and transparency in reporting.
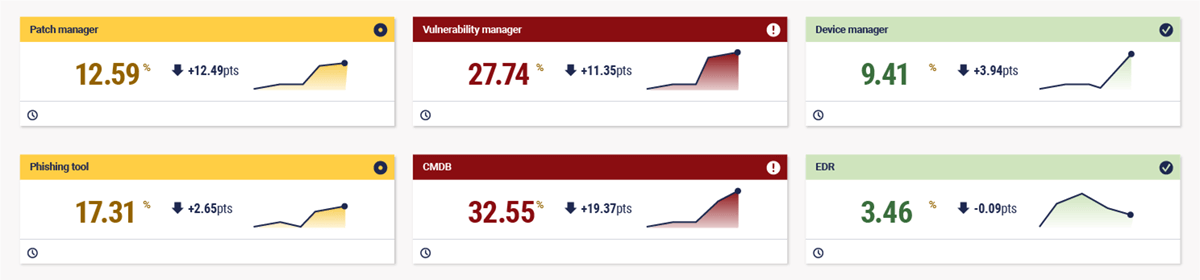
Here’s an example of a control coverage dashboard from our platform, which shows the percentage of devices missing from a particular source, highlighting control gaps. It includes several of the tools that are essential to the range of controls we will discuss, such as a patch manager, vulnerability scanner, and phishing tool.
Beyond the coverage of controls, here are some example metrics to share with your board:
a. Vulnerability management metrics
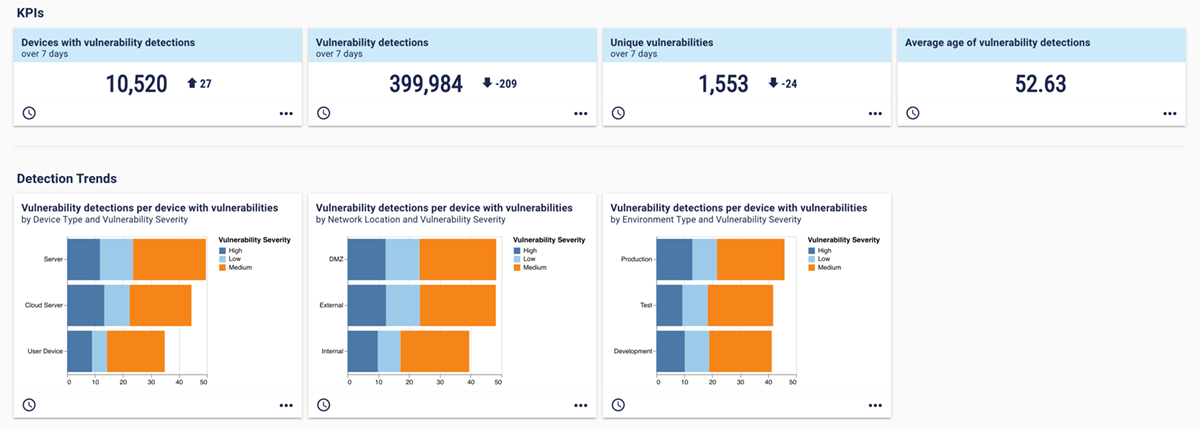
Vulnerability management is a key measure of how you’re proactively managing risks. It’s important to show not just an understanding of the number of vulnerabilities, but also where they sit in the organization, and how you're managing the risk in specific areas of the business. For example, this vulnerability diagnostics dashboard from our platform explores some of the hard numbers around vulnerabilities. It provides context on severity, device type, network location, and environment type, which shows how vulnerabilities relate to business risk.
b. Patch management metrics
Vulnerability management and patch management go hand in hand. If you consider vulnerability management to be technology metrics, patch management would be the process that fixes the problems. You can use your metrics to show how effectively you're patching vulnerabilities and sticking to an established threshold (or SLA – service level agreement – in the dashboard) aligned to the organization’s cybersecurity risk appetite. Here's an example dashboard that shows key metrics for patch performance, including outstanding patches, time to patch, and patches recently deployed. 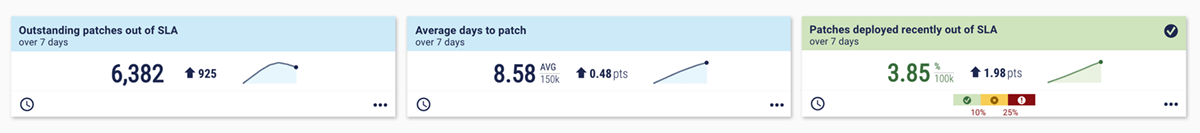 Within patch and vulnerability management, Pam notes the importance of discovering “high-risk areas”. You can overlay metrics to find vulnerabilities that pose a heightened risk. These can be used to help prioritize remediation for the cybersecurity team and highlight risk to the board. For example, you can overlay metrics. This dashboard highlights devices that are missing from two key controls, almost like a “toxic combination” of risk:
 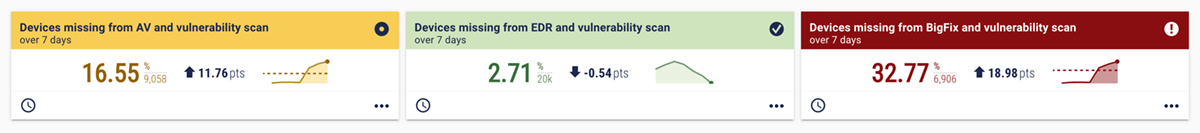 To make your reporting more relevant and compelling for board members, you could even build a report using metrics that measure your protection against specific threats, such as ransomware. You can download our guide for more detail on this topic: The CISO’s guide to creating an effective ransomware board report. Pam provides a further tip: “You need to use trends to show the spikes and dips over time. Tell a story that explains why you’re encountering any significant changes, which can be indicators for remediation efforts that may require resources or more effective tools.” To really understand what’s happening, you need to measure continuously and track trends over time with root cause analysis.
c. Security culture metrics
Security culture is an important “people” metric. However, it can be difficult to accurately measure security culture, particularly its impact on business risk. Do you have champions in the wider business who talk about and promote good security practices? These people are hugely valuable, but it’s hard to put metrics around them if promoting security isn’t part of their job role. There are metrics that are a valuable indicator. One suggestion from Pam is phishing campaign metrics. Here’s a dashboard from the Panaseer platform with some phishing metrics split by employee type and department. It’s interesting to see how employees of different seniority perform on phishing tests. Perhaps include a metric for board-level employees too, which could help engage your audience. 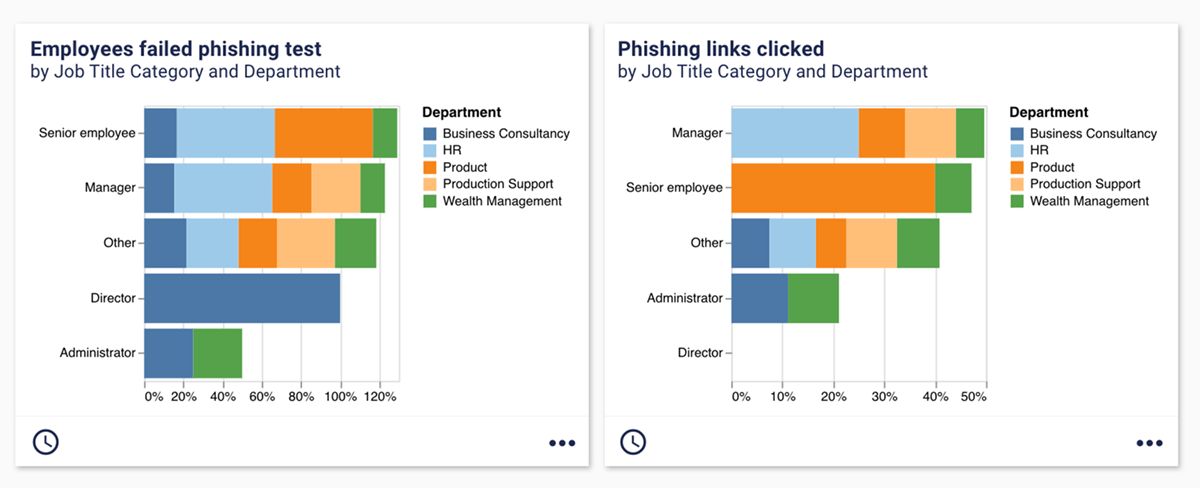
Gamification can also help to measure and improve security culture. Company-wide leaderboards show which teams are performing best around your phishing program – points won for spotting and reporting a phish, points lost for clicking on a phish.
3. Boards need to know if you’re within risk tolerance
The board is ultimately responsible for managing business risk, including cybersecurity risk.
In fact, new legislation, such as the EU's DORA regulation, makes the board legally accountable for it. As such, they need a continuous understanding of how security is performing against the organization’s established risk appetite.
In cybersecurity, that means measuring performance against specific tolerance thresholds that align to your risk appetite. Almost every metric will have a risk tolerance threshold (unless they are straightforward counts, such as the number of devices in the organization). It’s a way of showing the board whether a metric result is “good” or “bad” using a red/amber/green status. There isn’t a lot of guidance out there on how to set thresholds for specific metrics, so many CISOs and security leaders need to create their own. With that in mind, it might be worth explaining your policy for tolerance thresholds, and how they reflect the overall risk appetite of the organization. If you’re struggling with this particular challenge, you can download our guide detailing example thresholds for a range of controls and metrics.
How can you improve reporting cybersecurity to the board?
Is every enterprise security team able to report this way? Possibly not. “It can be a very manual process for some organizations,” says Pam. It takes a lot of hours to create this kind of report. In fact, our Security Leaders Peer Report found that security teams spend around half their time on reporting.
Automation is the answer. “Instead of spending your time gathering the data, automating the process leveraging a product like Panaseer means your people can spend time on more important activities.” Automation also improves data trust.
Pam noted the irritation of that challenge: “The amount of time spent debating the accuracy of the numbers...” When you bring in automation, there is more trust across stakeholders and teams. Everyone is working from the same set of data, so there isn’t any finger-pointing. That trust gives you a solid foundation when you're discussing cybersecurity in the boardroom. To find out more about automating security reporting, metrics and measurement, whether to help with your board reporting or otherwise, get in touch.
About the author
Barnaby Clarke
Related blogs

Four security metrics that prove you’re a good bet for cyber insurance